
Bolt Challenge Data Analysis
Project Description 🚀
-
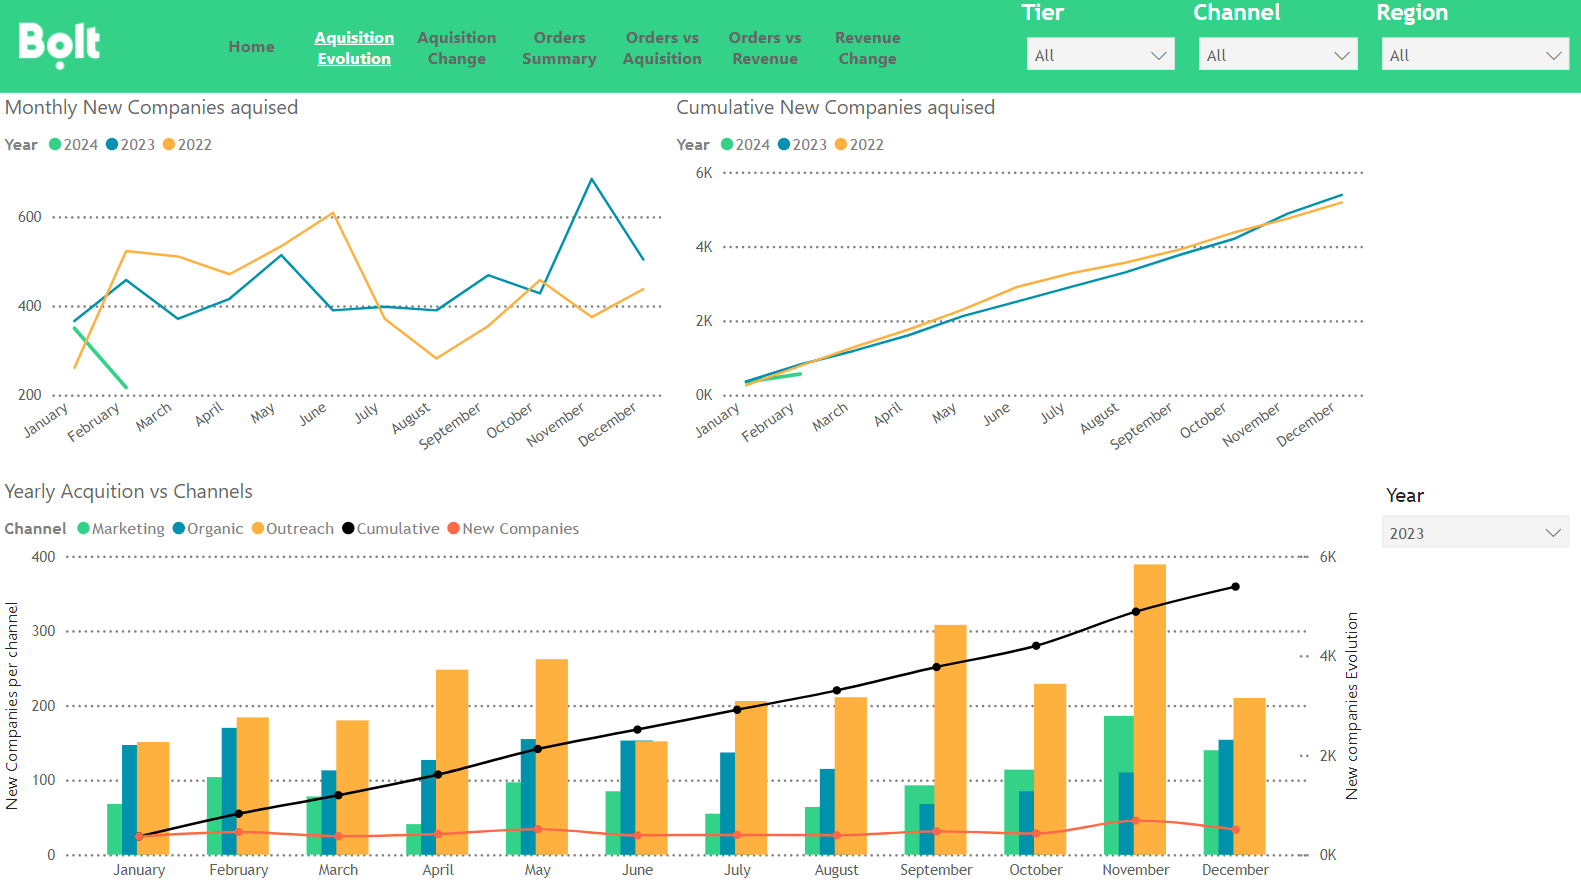
Dashboard Creation 📊 Developed a Power BI dashboard focused on:
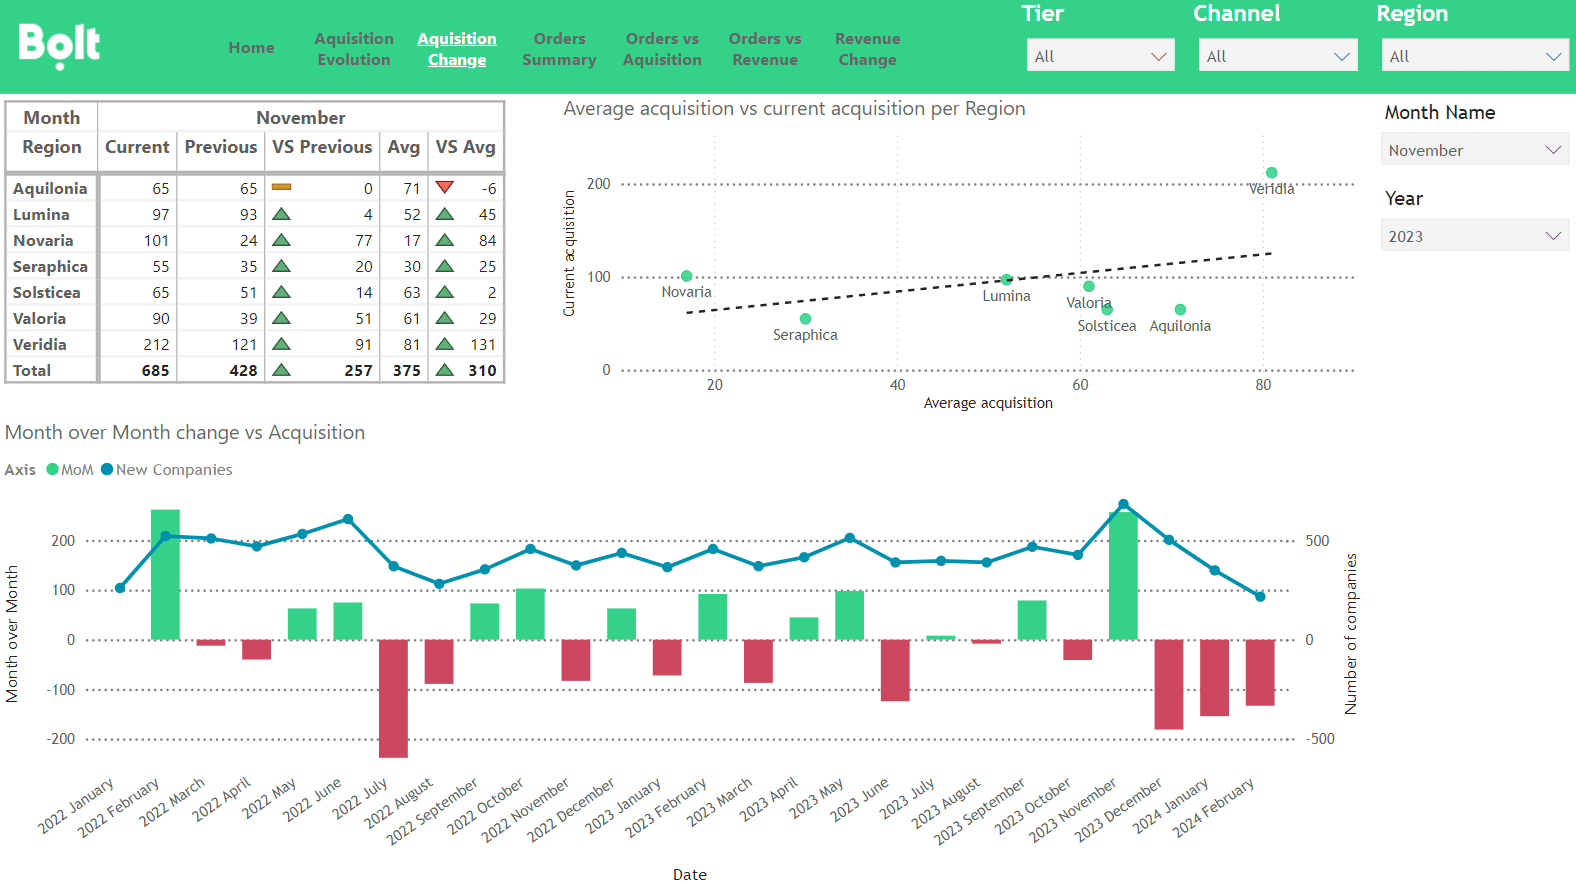
- Acquisition of New Companies and Its Change: Tracking the growth in acquired companies over time.
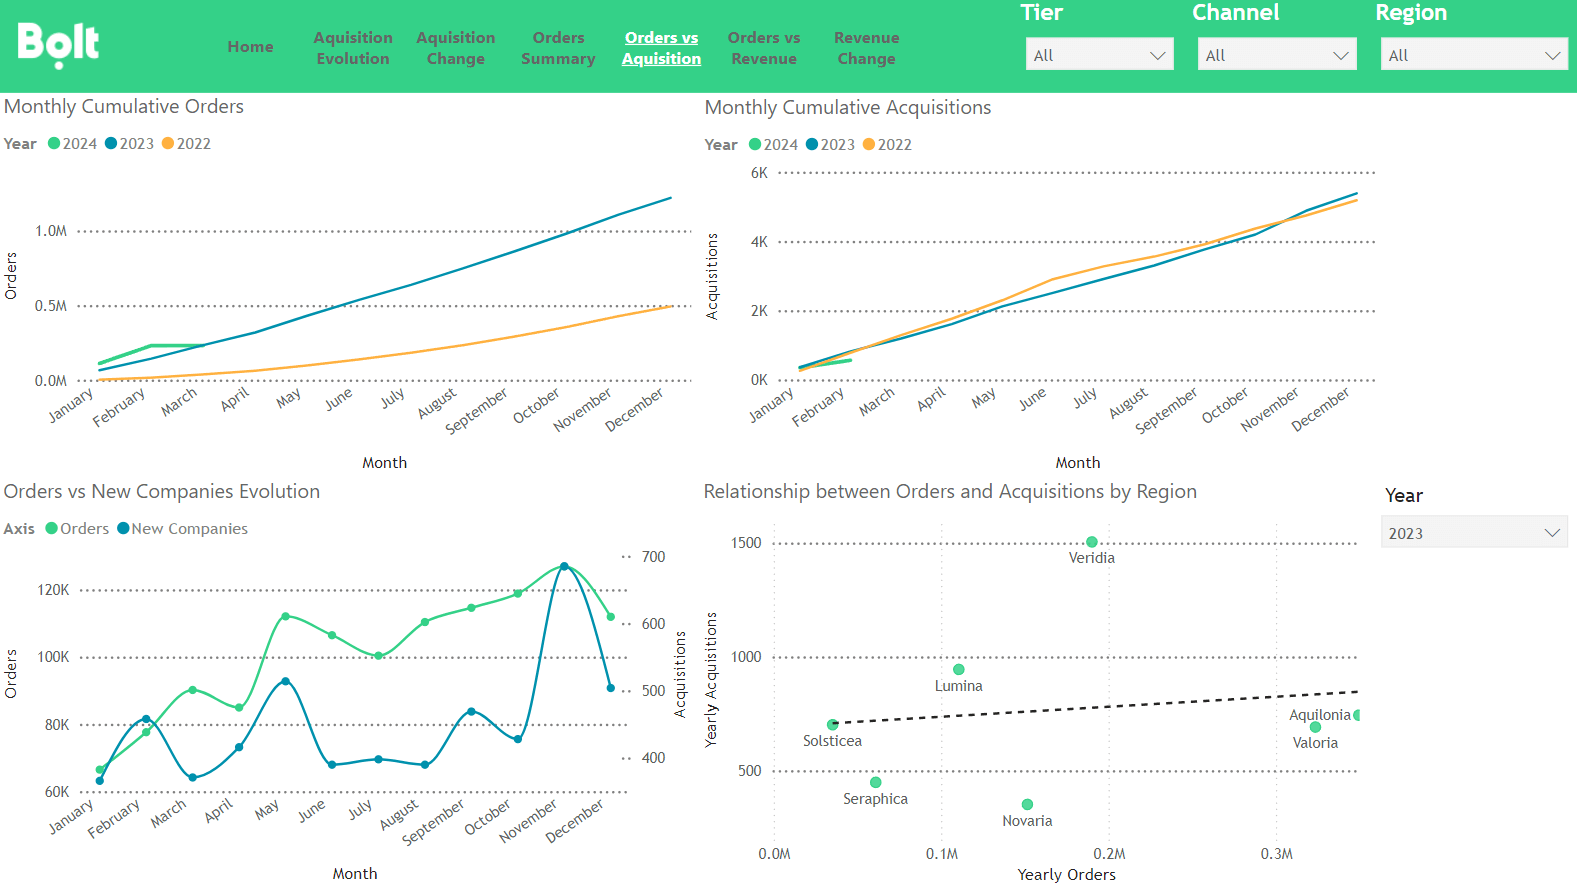
- Relationship Between Orders and Acquisition: Analyzing how customer orders are influenced by company acquisitions.
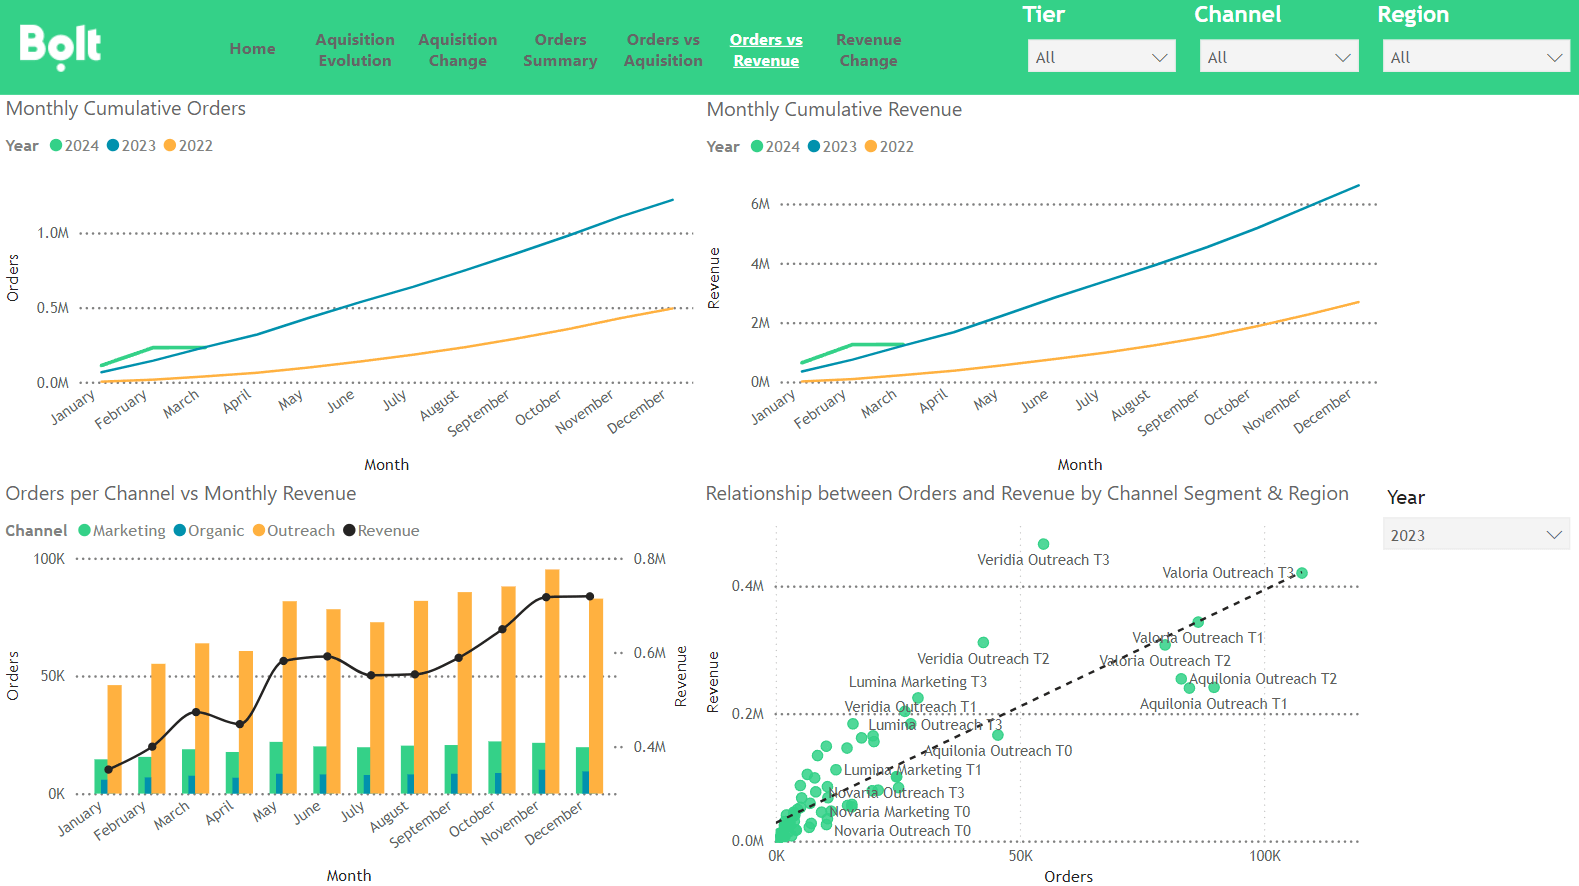
- Relationship Between Orders and Revenues: Identifying the correlation between customer orders and revenue generation.
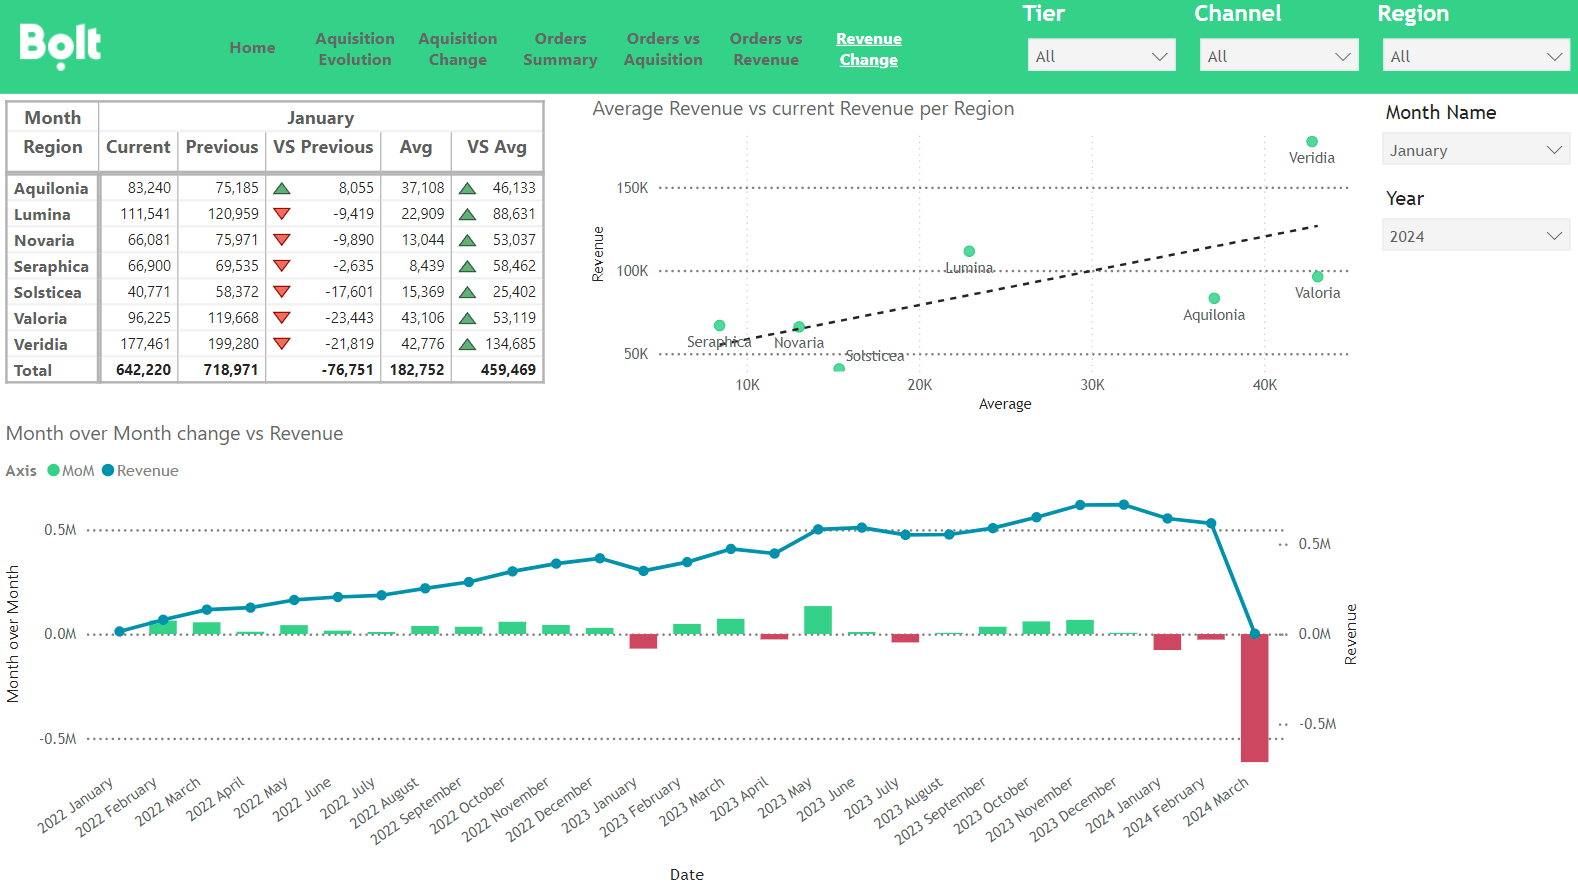
- Revenue Change Over Time: Highlighting revenue trends and key performance indicators.
- Acquisition of New Companies and Its Change: Tracking the growth in acquired companies over time.
-
Presentation Creation 🖼️ Created a professional presentation to convey findings and insights derived from the dashboard. The presentation covered the following sections:
- Executive Summary
- Introduction
- Methodology
- Code
- Findings
- Conclusion
- Appendix
-
One-Page Report Creation 📝 Developed a concise, data-driven report identifying and addressing key inefficiencies in Bolt’s delivery operations. Steps included:
- Analyzing Delivery Inefficiencies: Studied the business case and identified operational inefficiencies affecting delivery speed and efficiency.
- Defining Requirements for the Proposed Solution: Outlined actionable solutions to mitigate inefficiencies.
- Feature Validation and Implementation: Suggested steps to validate and integrate the proposed features into Bolt’s delivery vertical.
Key Deliverables 🎯
- Power BI Dashboard
- Insightful Presentation
- One-Page Report Document
Skills Implemented 🛠️
- Power BI dashboard design
- Data visualization
- Data analysis and insights generation
- Business case study
- Presentation design and storytelling
- Analytical problem-solving
- Operational efficiency analysis
- Report writing and documentation